Profile
Legal Structure
Sargodha Jute Mills
Limited (hereafter referred to as “Sargodha Jute” or “the Company”) was
established on February 10, 1981, as an unlisted Public Limited Company under
the provisions of the repealed Companies Act, 1913 (now replaced by the
Companies Act, 2017). The Company’s registered office is located at 19-B, Off
Zafar Ali Road, Gulberg-V, Lahore, while its regional office is located at 309
Uni Tower, 3rd Floor, I.I. Chundrigar Road, Karachi.
Background
The Company was founded
in 1981 by the late Mian Muhammad Aslam. The group operates one jute mill and
one textile mill. Following the founder's tenure, the operations of Sargodha
Jute were entrusted to his son, Mian Parvez Aslam. Subsequently, the leadership
transitioned to the next generation, with the two sons of Mian Parvez Aslam
serving as the Chairman and CEO of the Company.
Operations
The core business
activity of the Company revolves around the manufacturing, sale, and
distribution of jute products, leveraging efficient machinery to maintain high
standards of quality and operational effectiveness. Sargodha Jute Mills Limited
offers a diverse product portfolio, which includes yarn, hessian cloth, hessian
bags, sacking bags, and twines. Additionally, the Government of Pakistan is a
key contributor to the Company’s revenue through substantial procurement of
sacking bags. The Company’s installed production capacity is ~30,500 MT/annum
(based on 360 operational days), with a utilization rate of ~38.54% in FY24
(FY23: ~75.07%).
Ownership
Ownership Structure
Mr. Parvez Aslam and his
family collectively hold a majority ownership stake of ~75% in the Company.
Within this, his sons, Mr. Irfan Aslam and Mr. Imran Aslam, each own a 28.32%
share. Additionally, Shahzad Textile Mills Limited, an associated company,
holds a 24.94% ownership stake in Sargodha Jute.
Stability
While there is currently
no formal succession plan in place, the ownership of shares and business roles
is evenly divided between the two sons of Mr. Parvez Aslam, Mr. Imran Aslam and
Mr. Irfan Aslam. Mr. Irfan Aslam serves as the CEO of Sargodha Jute Mills
Limited, while Mr. Imran Aslam holds the position of CEO at Shahzad Textile
Mills Limited. Establishing formal documentation for succession planning could
significantly enhance the long-term stability and continuity of the Company.
Business Acumen
Mr. Irfan Aslam, serving
as the CEO of Sargodha Jute Mills Limited, brings over two decades of extensive
experience in overseeing the Company’s operations. His strong strategic acumen
and ability to make timely, effective decisions have been instrumental in
steering the Company towards sustained growth and stability.
Financial Strength
Mr. Irfan Aslam holds a 24.85%
ownership stake in the associated company, Shahzad Textile Mills Limited, which
boasts a robust asset base of ~PKR 5.9bln as of Jun’24. In addition to his
business interests, Mr. Irfan Aslam demonstrates a strong financial acumen
through active investments in diverse sectors, including real estate, the stock
market, and foreign exchange markets. The Company is expected to get timely
support from its sponsors, if needed.
Governance
Board Structure
The Company's board
comprises three members, two of whom belong to the sponsoring family. Mr.
Irfan, serving as the CEO, and Mr. Ahsan, acting as the COO, hold executive
director positions. Meanwhile, Mr. Imran, who chairs the board, serves as a
non-executive director. The compact size of the board, with key leadership
roles primarily held within the sponsoring family, reflects a concentrated and
efficient decision-making approach. However, an independent oversight could
enhance the governance structure, fostering greater transparency and balance in
strategic decision-making.
Members’ Profile
Mr. Irfan Aslam, a
graduate of a prestigious foreign university, brings over two decades of
expertise in the jute industry and currently serves as the CEO of Sargodha Jute
Mills Limited. While Mr. Imran Aslam, with a strong foothold in the textile
sector, holds the position of CEO at Shahzad Textile Mills Limited. Their
extensive experience and leadership have been pivotal in driving the Company’s
growth and sustainability.
Board Effectiveness
The board’s overall
effectiveness is hindered by its limited size and the significant influence of
the sponsoring family, which may affect diverse and balanced decision-making.
Additionally, the practice of board meetings held on an “as and when needed”
basis reduces the opportunity for structured and regular oversight.
Furthermore, the lack of independent directors and the absence of specialized
board committees limit the board’s ability to provide robust governance and
strategic guidance.
Financial Transparency
Crowe Hussain Chaudhry
& Co., Chartered Accountants, a QCR-rated firm and listed in the category ‘A’
on SBP’s panel of auditors, serve as the Company’s external auditors. They have
expressed an unqualified opinion on the annual financial statements for the
year ended June 30, 2024.
Management
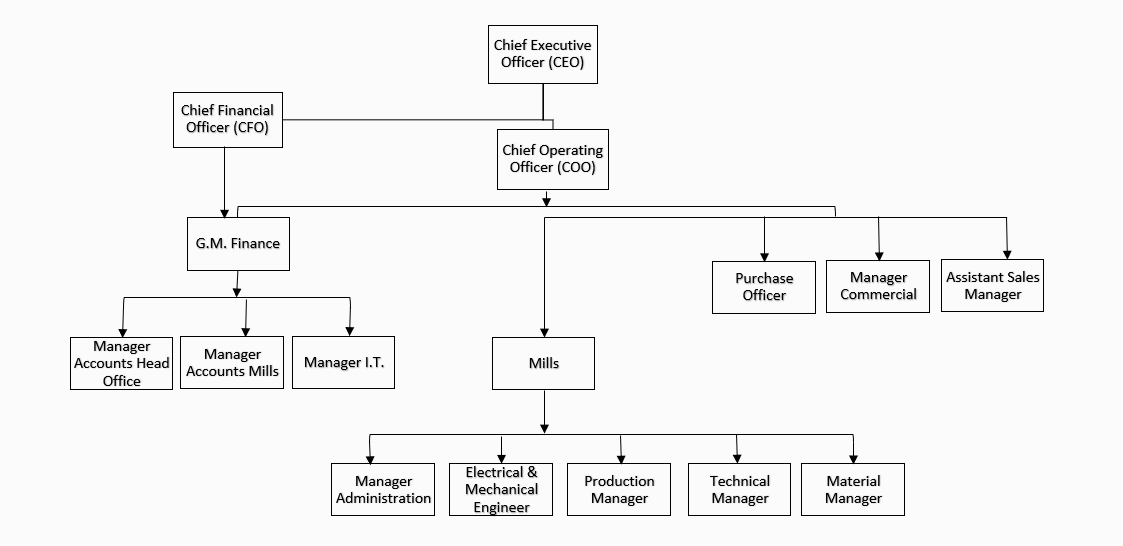
Organizational Structure
The Company’s
organizational framework is structured into two primary divisions: the Head
Office and the Mills. All key positions within the organization are filled. Major
functional departments include, (i) Accounts & Finance, (ii) Procurement,
and (iii) Production. The Chief Financial Officer (CFO) directly reports to the
Chief Executive Officer (CEO), establishing a clear financial oversight
hierarchy. Meanwhile, the Purchase Manager and Manager Commercial from the Head
Office, along with the Mill Managers, report to the Chief Operating Officer
(COO), fostering streamlined coordination between the operational and
managerial divisions.
Chart 1: Organizational Structure
Management Team
Mr. Irfan Aslam, the CEO,
is a graduate of a reputed foreign university and brings over two decades of
extensive experience in the jute industry. He holds the authority to make
strategic decisions for the Company, ensuring its continued growth and success.
Supporting him is Mr. Imran Haider, the CFO, who has been associated with the
group for nine years and has served in his current role for one year. Mr. Ahsan
Ahmad Khan, the COO, has dedicated 29 years to Sargodha Jute Mills Limited and
possesses a wealth of experience in the jute industry and oversees day-to-day
operations. Another key team member is Mr. Ayyaz Ali Shahid, the Manager
Commercial, who has been with the Company for the past seven years. He
specializes in raw jute procurement from Bangladesh, a critical component of
the Company’s supply chain. Additionally, the finance department is primarily
headed by Mr. Tahir, the General Manager of Finance, who ensures effective
financial management and oversight within the organization.
Effectiveness
With the support of a highly skilled and experienced team of
professionals, Sargodha Jute continues to enhance its business capabilities.
The management functions are well-defined and supported by a strong IT
infrastructure and comprehensive internal controls, enabling effective
operational oversight and decision-making. However, the lack of management
committees and internal audit function limits the ability to ensure seamless
communication and coordination across various functions.
MIS
Sargodha Jute Mills uses
oracle-based ERP system by the name of Wizmen. Regular reporting of sales
figures, raw materials positions, payables & receivables and income
statement on monthly basis is shared with top management. Secondly, the Company
uses Kaspersky registered antivirus software to protect the data of the
Company. On the other hand, data from the production facility is shared on
real-time basis because point to point link has been developed between the mill
and head office.
Control Environment
The Company is ISO 9001-2015 certified, reflecting its adherence to
internationally recognized quality management standards. A dedicated quality
control department ensures the consistent delivery of high-quality products to
customers. Additionally, the Company has implemented an efficient system for
addressing customer complaints and providing prompt resolutions, further
enhancing customer satisfaction. However, the establishment of an internal
audit function could strengthen transparency and reinforce internal controls,
contributing to a more robust governance framework.
Business Risk
Industry Dynamics
Pakistan’s economy is
facing serious challenges such as uncertain economic conditions, high energy
costs, high interest rates and inflation. These factors present a serious
challenge for a business; by increasing costs on one hand and by decreasing consumers’
buying power on the other hand. In the coming year, further reduction in
interest rates is expected, however, economic recovery is also expected to
remain slow in coming year. During FY24, the domestic market capitalization of
the Jute Sector was valued at ~PKR 33.5bln, marking a substantial year-on-year
(YoY) growth of ~18.8% compared to PKR 28.2bln in the previous year. From FY19
to FY23, the average production levels of jute goods were ~65,000 metric tons
(MT). However, in FY24, total jute goods production witnessed a sharp decline
of ~35.0%, dropping to ~41,000 MT from ~63,000 MT in FY23. Among the various
product categories, sacking bags maintained their leading position,
contributing ~65.9% to the total production in FY24, with output recorded at
~26,500 MT, representing a YoY decrease of ~43.8%. Other product categories,
such as Hessian Cloth and Miscellaneous Products, accounted for ~26.8% and
~7.3% of the total production, respectively, during FY24. Likewise, the
production utilization of the sector’s key players declined in the current
year. The installed production capacity of the five major players in the local
Jute Mills Sector remained unchanged and stood at ~114,300 MT in FY24. Notably,
Thal Limited and Sargodha Jute Mills collectively dominated the market, holding
a combined share of ~75% of the sector’s total production capacity.
Relative Position
The jute industry in
Pakistan comprises only a few key players, creating a concentrated competitive
landscape. Sargodha Jute ranks as one of the two largest players in the sector,
boasting an annual installed production capacity of 30,500 MT. As per the
management, the Company holds a market share of ~40%. Thal Jute Mills, the
largest competitor, holds a slightly higher market share, supported by its
marginally larger installed capacity of 33,800 MT. The remaining market share
is distributed among smaller players, including White Pearl Jute Mills, Indus
Jute, and Madina Jute, each contributing a relatively modest portion to the
industry landscape.
Revenues
Sargodha Jute Mills
Limited’s turnover faced significant pressure in FY24, as revenue contracted by
~36.4% to ~PKR 5,162mln, down from ~PKR 8,113mln in FY23. This marked
deterioration stemmed from various factors. Export sales witnessed a sharp
decline of ~46.5%, primarily driven by elevated production costs, which eroded
the competitiveness of the Company in global markets. Domestically, the prior
year benefitted from an unusually high level of jute bag procurement by the
government, a demand surge that was not sustained in FY24.
Graph 1: Revenue & Margins
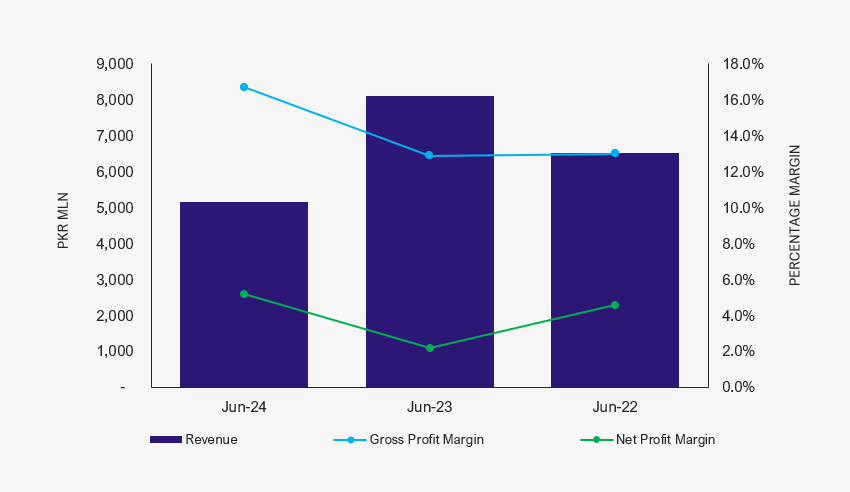
Margins
During FY24, the Company
demonstrated a notable improvement in profitability metrics. The gross margin
increased to ~16.7% (FY23: ~12.9%, FY22: ~13%), primarily driven by enhanced
cost efficiencies. Similarly, the operating margin improved to ~12.1% in FY24,
up from 9.3% in FY23 (FY22: ~9.2%), reflecting better operational performance. Furthermore,
the net profit margin recorded a significant rise, reaching ~5.2% in FY24
(FY23: ~2.2%, FY22: ~4.6%). This substantial increase was largely attributable
to a rise in other income, showcasing the Company’s ability to improve and
sustain its bottom line despite external challenges.
Sustainability
The Company remains
proactive in addressing the challenges by implementing strategic measures to
mitigate adverse impacts. To reduce escalating energy costs, the Company is
actively investing in renewable energy solutions. An extension of 420 KW was
completed after June 2024, with a further expansion of 1,500 KW underway and
expected to become operational by April 2025. This will bring the total solar
energy capacity at the mills to 2.2 MW, demonstrating the Company’s commitment
to sustainability and cost efficiency. Jute bags remain the Company’s flagship
product, valued for their environmentally friendly and biodegradable
properties. With growing social awareness and a global shift towards eco-friendly
products, jute bags are well-positioned to become the preferred choice among
consumers, further enhancing the Company’s market appeal and long-term
sustainability.
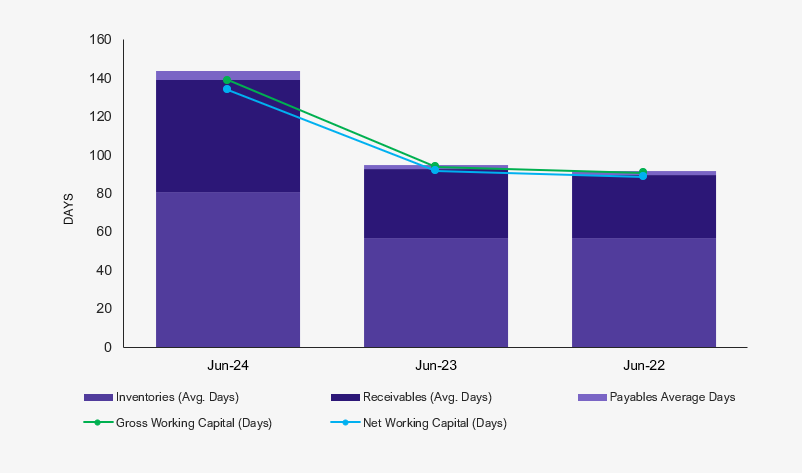
Financial Risk
Working capital
During FY24, the Company’s gross working capital days rose to 139 days
(FY23: ~94 days, FY22: ~91 days),
reflecting an extension of the cash cycle. Similarly, net working capital days
increased to 134 days in FY24 (FY23: ~92 days, FY22: ~16 days). This decline was
primarily attributable to elevated inventory levels, driven by the unusually
high procurement of jute bags by the government in the preceding year and the
subsequent carryover of inventory disturbed the Company’s cash conversion cycle.
Graph 2: Working Capital Cycle
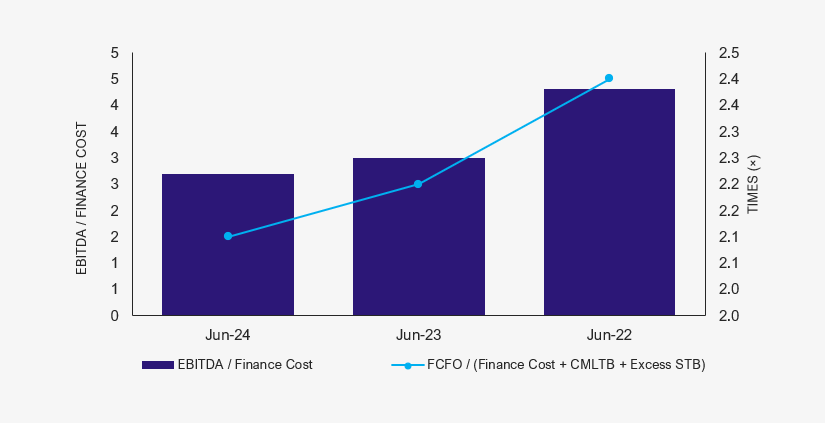
Coverages
During FY24, free cash
flows from operations also remained the same at ~PKR 621mln (FY23: ~PKR 658mln,
FY22: ~PKR 492mln). Interest coverage ratio is slightly under stress mainly on
the back of a significant surge in finance costs which stood at ~PKR 323mln in
FY24 (FY23: ~PKR 327mln, FY22: ~PKR 173mln). Company’s investment portfolio consists
of ~PKR 426mln TDRs and ~PKR 276mln listed equity security investments.
Graph 3: Financial Coverages
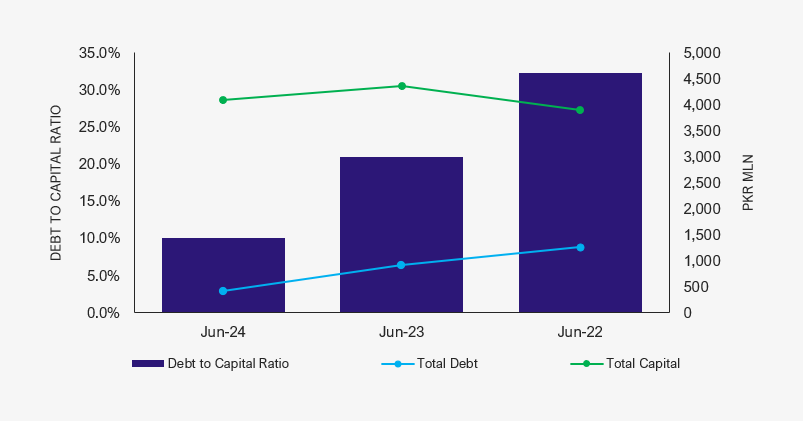
Capitalization
The Company has gradually
reduced its borrowings and increased its equity on the back of revaluation of
assets resulting in a reduced leverage of 10.0% in FY24 (FY23: 20.9%, FY22:
32.3%). Total borrowings of the Company decreased to ~PKR 410mln (FY23: PKR
909mln, FY22: PKR 1,260mln). The debt portfolio solely comprises short-term
borrowings to meet the working capital needs of the Company.
Graph 4: Capital Structure
|
