Rating History
Dissemination Date Long-Term Rating Short-Term Rating Outlook Action Rating Watch
22-Apr-25 BBB A2 Stable Maintain -
23-Apr-24 BBB A2 Stable Maintain -
03-May-23 BBB A2 Stable Maintain -
14-Sep-22 BBB A2 Stable Initial -
About the Entity

The Company was established in 2005 as Jilani Enterprises. In 2012, Jilani Enterprises was renamed to Salman Paper Products Private Limited and got registered with SECP as on 2019 with as hare capital of PKR 20mln. The Company is owned by CEO/owner Mr. Muhammad Aslam Jilani having 99% shareholding. Although Salman Paper Products deal in four main products, but it has wide spread customer and supplier base. The Company imports finished goods as raw material and sells to customers after cutting and printing, selling to northern, central and southern regions of Pakistan. Four products; namely: Art card, Packaging board, Stickers and Printer paper are sold to customers divided into direct sales and dealerships - who resell to other customers. About 70% of customer base of Salman Paper Products is located in southern region.

Rating Rationale

Salman Paper Products Private Limited ("the Company") is a prominent player in the import and trade of paper and board, operating with a high-turnover and efficient business model. This approach has solidified its position as a leading importer, particularly in southern markets. The Company is led by Mr. Aslam Jilani, its sponsor and CEO, who brings over 30 years of industry expertise and plays a pivotal role in its operations. While the Company's governance structure is relatively simple—comprising only two board members and lacking formal board committees—its management team demonstrates strong operational expertise and a deep understanding of industry dynamics. Demand for its products is primarily driven by paper and paperboard consumers, and its stable customer base supports its credit rating. The Company has experienced a substantial increase in sales volume driven by heightened market demand. This surge has also resulted in higher plant production, with output levels aligning with the increased demand. With an annual production capacity of approximately 31,000 MT, its utilization rate surged to around 90% in FY24, up from 70% in FY23. During FY24, the Company reported topline revenue of PKR 13,560 million, marking a 34% increase from PKR 10,091 million in FY23 (FY22: PKR 9,542 million). The bottom-line profit also grew to approximately PKR 273 million in FY24, up from PKR 171 million in FY23. Moving forward, product demand is expected to stabilize in line with economic conditions. Salman Paper Products maintains a moderately leveraged capital structure, primarily using short-term debt to meet its working capital needs. As of June 2024, the Company's equity stood at PKR 1 billion. To further enhance governance and oversight, the establishment of an internal audit department under the direct supervision of the directors is encouraged.

Key Rating Drivers

The ratings are dependent upon the management’s ability to improve margins while sustaining its market share. Prudent management of the working capital and maintaining sufficient cash flows and coverages are essential for the ratings. Any significant change in margins and coverages will impact the ratings.

Profile
Legal Structure

Salman Paper Products (Pvt.) Limited (or "the Company") was incorporated as a Private Limited Company under the Companies Ordinance, 1984 in October 2011.


Background

In 2005, Salman Paper Products was established as Jilani Enterprises and in 2011 Jilani Enterprises was renamed to Salman Paper Products Private Limited. The Company is primarily engaged in the import, cutting and sizing, printing and trade of paper in the local market.


Operations

Salman Paper Products (Pvt.) Limited deals in four products; namely: Art cards, Packaging board, Stickers, and Printer paper. The Company imports the paper from China, Malaysia, and Indonesia and sells to northern, central, and southern regions of Pakistan. Customers of the Company are divided into direct customers and dealers (who resell to other customers). Among the dealers 4 are located in the central region, 2 are located in the northern, and 2 dealers are in the southern region of Pakistan


Ownership
Ownership Structure

The Company is privately owned by two shareholders - Majorly by Mr. Muhammad Aslam Jilani: 99% shares and remaining 1% shares by Mr. Muhammad Faisal.


Stability

Ownership structure is stable as owners have vast experience in the packaging industry while having a personal stake in business. Being part of a group wherein tacit intergroup cooperation exists, bodes well to the rating.


Business Acumen

Mr. Aslam Jillani brings over 20 years of experience in the sector, during which he has gained extensive knowledge of business processes and industry trends through his broad associations and expertise.


Financial Strength

The light asset and high turnover base model of business has provided strength to the Company to establish its brand name amongst the leading importers of paper and related products in the south market.


Governance
Board Structure

The BoD of the Company comprises of 2 members who are also owners. Mr. Muhammad Aslam Jilani is the executive director and Mr. Muhammad Faisal is the non-executive director of the Company.


Members’ Profile

Mr. Muhammad Aslam Jilani with his extensive experience of more than 20 years, looks after the governance side of the business. He has developed excellent business relationships with buyers and suppliers.


Board Effectiveness

The Board has only two members and in comparison, to established corporates, the governance model is weak and needs improvement. The Board has no formal committees to assist the board.


Financial Transparency

M/s Mushtaq & Co. Chartered Accountants are the external auditors of the Company. They have expressed an unqualified opinion on the financial reports of Salman Paper Products (Pvt.) Limited for period ending Jun-24. The firm is QCR rated by ICAP and is in the "B" Category of SBP’s panel of auditors. The absence of an internal audit function further creates room for improvement in the corporate governance framework.


Management
Organizational Structure

Salman Paper Products (Pvt.) Limited has developed a defined organizational structure keeping in mind the Company’s operational needs. Currently, the organizational structure is divided into four main functions namely; 1) Sales & Marketing 2) Purchase 3) Accounts & Finance, and 4) Collection & Recovery.


Management Team

The management team consists of the owners, with Mr. Muhammad Aslam Jilani serving as the CEO, and Mr. Faisal Iqbal holds the position of Chief Operating Officer, overseeing the Company’s major operations.


Effectiveness

The experience of the sponsors along with a professional management team has helped the Company to streamline its operations. However, Management’s effectiveness and efficiency can be ensured through the presence of management committees. At Salman Paper Products (Pvt.) Limited, absence of management committees are indicating the room for improvement.


MIS

The Company’s Management Information System (MIS) produces detailed financial reports on a monthly basis. In addition, the MIS prepares various management reports that offer valuable insights for senior management’s evaluation. These reports are designed to aid in informed decision-making by focusing on key performance indicators, financial trends, and operational metrics. The company utilizes SAP Business ERP software to generate both MIS and operational reports.


Control Environment

For identification, assessment, and reporting of all types of risk arising out of the business operations because there is no internal audit department in place to ensure operational efficiency which operates under the direct supervision of directors.


Business Risk
Industry Dynamics

Pakistan’s packaging industry consists of four major segments, paper, plastic, tinplate and glass. Paper and plastic segments occupy the major share in total market. Despite, the economic slowdown caused by several issues, demand for the segment remained almost consistent as it falls in the supply chain of various essential products and industries. The segment’s direct costs consist largely of imported raw materials. Chemical wood pulp is one of the main raw materials in the production of paper packaging. Therefore, volatility in exchange rates and international price trends has an impact on costs.The production levels of Paper over the last five years have experienced a CAGR of ~7.2%. This reflects the stability of the segment as it makes up a significant portion of overall Paper and board production. The production of Paper increased in FY24 to ~366,267MT from ~311,675MT in FY23 with an increase of ~17.6% YoY. (Source: PACRA Sector Study)


Relative Position

Salman Paper Products (Pvt.) Limited maintains a strong market presence in Pakistan for importing Art cards, Packaging board, Stickers, and Printer paper, holding a significant share in these product categories.


Revenues

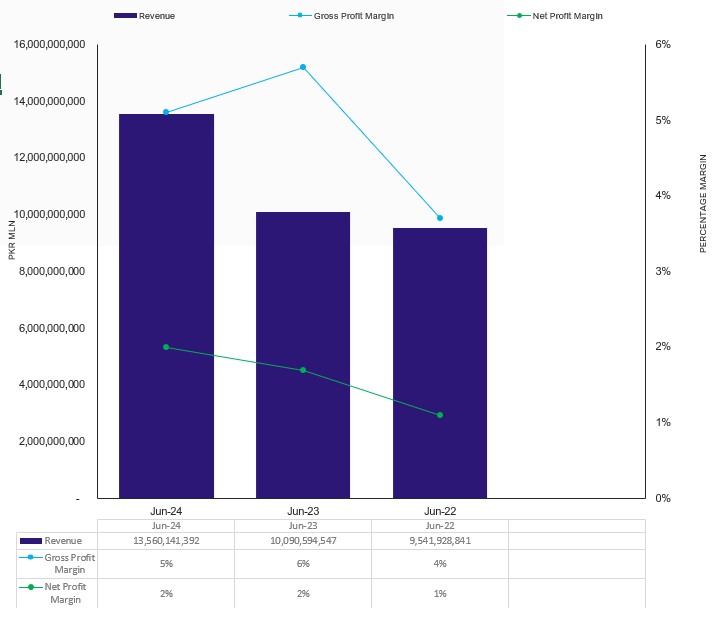
The Company’s top line shows an increasing trend due to increase in sale price but the increase in prices of products has impacted demand. During FY24, the Company generated a top line of ~PKR 13,560mln (FY23: ~PKR 10,091mln, FY22: ~PKR 9,542mln), showing an increase of ~ 34% in revenue.


Margins

The paper rolls used by the Company are entirely imported, and to maintain its profit margins, the Company passes on the increased costs to its B2B consumers. In FY24, the gross profit margin declined from ~5.7% in FY23 to ~5.1% due to a rise in the cost of goods sold. Similarly, the operating profit margin decreased from ~5.2% to ~4.5% during the same period, driven by an increase in operating expenses. However, the net profit margin improved, rising from  ~1.7% to ~2.0%, reflecting an increase in net income. The Company's bottom line for FY24 reached PKR 273mln, up from PKR 171mln in FY23 (FY22: PKR 104 mln).


Sustainability

Salman Paper Products (Pvt.) Limited has a well-established brand name in the market, especially in Art cards, Packaging board, Stickers, and Printer paper products.


Financial Risk
Working capital

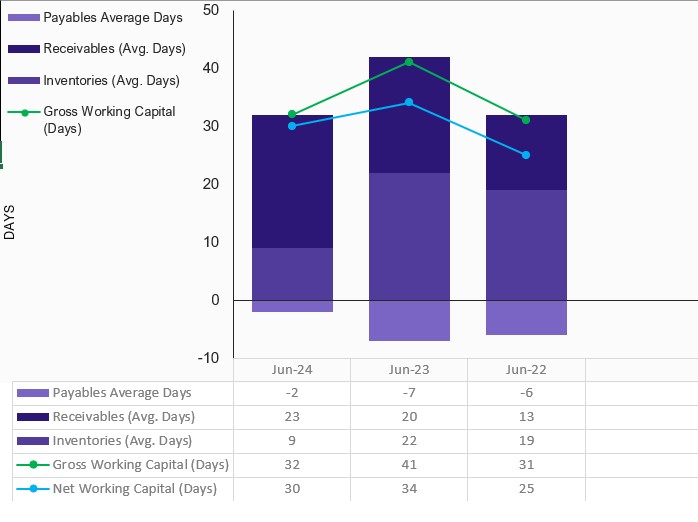
Salman Paper Products (Pvt.) Limited has seen a significant improvement in its inventory turnover, inventory days decreasing from ~22 days at end-Jun23 to ~9 days at end-Jun24. This reduction in inventory days reflects the company's enhanced operational efficiency and stronger inventory management, resulting in a faster turnover of stock and improved overall business performance. The trade receivable days increased from ~20 days to ~23 days during the same period. But the trade payable days decreased from ~41 days at end FY23 to ~32 days at end FY24. Consequently, the Company’s net working capital days decreased to ~29 days at end FY24 from ~35 days at the end of FY23.


Coverages

In FY24, the Company’s FCFOs stood at ~PKR 398mln FY24 decreasing from ~PKR 463mln in FY23 (FY22: ~PKR -136mln). As result during FY24, FCFO/Finance cost stood at ~ 2.2x FY24 decreased from ~ (2.7x) of coverage during FY23 (FY22: ~-1.4x). The finance cost stood at ~PKR 181mln increased from ~PKR 173mln (FY22: ~PKR 97mln).


Capitalization

The Company has a moderate leveraged capital structure primarily relying on short-term debt for managing its working capital needs. Its gearing ratio has decreased from ~53.4% at the end of FY23 to ~50.5% at the end of FY24 due to increase in short-term borrowing. STB borrowing has increased to ~PKR 1,022mln from ~PKR 837mln during the same period.


Apr-25

www.pacra.com


Jun-24
12M
Jun-23
12M
Jun-22
12M
A. BALANCE SHEET
1. Non-Current Assets 86 64 39
2. Investments 26 0 0
3. Related Party Exposure 0 0 0
4. Current Assets 2,381 1,661 2,105
a. Inventories 352 268 927
b. Trade Receivables 977 724 374
5. Total Assets 2,494 1,725 2,144
6. Current Liabilities 469 158 372
a. Trade Payables 107 58 313
7. Borrowings 1,022 837 1,164
8. Related Party Exposure 0 0 49
9. Non-Current Liabilities 0 0 0
10. Net Assets 1,003 730 559
11. Shareholders' Equity 1,003 730 559
B. INCOME STATEMENT
1. Sales 13,560 10,091 9,542
a. Cost of Good Sold (12,875) (9,520) (9,189)
2. Gross Profit 685 570 353
a. Operating Expenses (76) (49) (35)
3. Operating Profit 610 521 319
a. Non Operating Income or (Expense) 46 (9) (1)
4. Profit or (Loss) before Interest and Tax 655 512 317
a. Total Finance Cost (181) (173) (97)
b. Taxation (201) (167) (116)
6. Net Income Or (Loss) 273 171 104
C. CASH FLOW STATEMENT
a. Free Cash Flows from Operations (FCFO) 398 463 (136)
b. Net Cash from Operating Activities before Working Capital Changes 217 299 (206)
c. Changes in Working Capital (394) 52 (650)
1. Net Cash provided by Operating Activities (177) 351 (856)
2. Net Cash (Used in) or Available From Investing Activities (52) (33) (26)
3. Net Cash (Used in) or Available From Financing Activities 185 (376) 838
4. Net Cash generated or (Used) during the period (43) (58) (44)
D. RATIO ANALYSIS
1. Performance
a. Sales Growth (for the period) 34.4% 5.8% 48.7%
b. Gross Profit Margin 5.1% 5.7% 3.7%
c. Net Profit Margin 2.0% 1.7% 1.1%
d. Cash Conversion Efficiency (FCFO adjusted for Working Capital/Sales) 0.0% 5.1% -8.2%
e. Return on Equity [ Net Profit Margin * Asset Turnover * (Total Assets/Shareholders' Equity )] 31.5% 26.6% 20.6%
2. Working Capital Management
a. Gross Working Capital (Average Days) 32 41 31
b. Net Working Capital (Average Days) 29 35 25
c. Current Ratio (Current Assets / Current Liabilities) 5.1 10.5 5.7
3. Coverages
a. EBITDA / Finance Cost 4.1 3.2 3.4
b. FCFO / Finance Cost+CMLTB+Excess STB 2.2 2.7 -1.4
c. Debt Payback (Total Borrowings+Excess STB) / (FCFO-Finance Cost) 0.0 0.0 -0.2
4. Capital Structure
a. Total Borrowings / (Total Borrowings+Shareholders' Equity) 50.5% 53.4% 68.5%
b. Interest or Markup Payable (Days) 74.8 77.5 101.6
c. Entity Average Borrowing Rate 19.5% 16.9% 17.9%

Apr-25

www.pacra.com

Apr-25

www.pacra.com

  1. Rating Team Statements
    1. Rating is just an opinion about the creditworthiness of the entity and does not constitute a recommendation to buy, hold, or sell any security of the entity rated or to buy, hold, or sell the security rated, as the case may be. (Chapter III; 14-3-(x))
    2. Conflict of Interest
      1. The Rating Team or any of their family members have no interest in this rating (Chapter III; 12-2-(j))
      2. PACRA, the analysts involved in the rating process, and members of its rating committee and their family members do not have any conflict of interest relating to the rating done by them (Chapter III; 12-2-(e) & (k))
      3. The analyst is not a substantial shareholder of the customer being rated by PACRA [Annexure F; d-(ii)]
      4. Explanation: for the purpose of the above clause, the term "family members" shall include only those family members who are dependent on the analyst and members of the rating committee.
  2. Restrictions
    1. No director, officer, or employee of PACRA communicates the information acquired by him for use for rating purposes to any other person, except where required under law to do so. (Chapter III; 10-(5))
    2. PACRA does not disclose or discuss with outside parties or make improper use of the non-public information which has come to its knowledge during a business relationship with the customer. (Chapter III; 10-7-(d))
    3. PACRA does not make proposals or recommendations regarding the activities of rated entities that could impact a credit rating of the entity subject to rating. (Chapter III; 10-7-(k))
  3. Conduct of Business
    1. PACRA fulfills its obligations in a fair, efficient, transparent, and ethical manner and renders high standards of services in performing its functions and obligations. (Chapter III; 11-A-(a))
    2. PACRA uses due care in the preparation of this Rating Report. Our information has been obtained from sources we consider to be reliable, but its accuracy or completeness is not guaranteed. PACRA does not, in every instance, independently verify or validate information received in the rating process or in preparing this Rating Report. (Clause 11-(A)(p))
    3. PACRA prohibits its employees and analysts from soliciting money, gifts, or favors from anyone with whom PACRA conducts business. (Chapter III; 11-A-(q))
    4. PACRA ensures before the commencement of the rating process that an analyst or employee has not had a recent employment or other significant business or personal relationship with the rated entity that may cause or may be perceived as causing a conflict of interest. (Chapter III; 11-A-(r))
    5. PACRA maintains the principle of integrity in seeking rating business. (Chapter III; 11-A-(u))
    6. PACRA promptly investigates in the event of misconduct or a breach of the policies, procedures, and controls, and takes appropriate steps to rectify any weaknesses to prevent any recurrence, along with suitable punitive action against the responsible employee(s). (Chapter III; 11-B-(m))
  4. Independence & Conflict of Interest
    1. PACRA receives compensation from the entity being rated or any third party for the rating services it offers. The receipt of this compensation has no influence on PACRA’s opinions or other analytical processes. In all instances, PACRA is committed to preserving the objectivity, integrity, and independence of its ratings. Our relationship is governed by two distinct mandates: i) rating mandate - signed with the entity being rated or issuer of the debt instrument, and ii) fee mandate - signed with the payer, which can be different from the entity.
    2. PACRA does not provide consultancy/advisory services or other services to any of its customers or their associated companies and associated undertakings that are being rated or have been rated by it during the preceding three years, unless it has an adequate mechanism in place ensuring that the provision of such services does not lead to a conflict of interest situation with its rating activities. (Chapter III; 12-2-(d))
    3. PACRA discloses that no shareholder directly or indirectly holding 10% or more of the share capital of PACRA also holds directly or indirectly 10% or more of the share capital of the entity which is subject to rating or the entity which issued the instrument subject to rating by PACRA. (Chapter III; 12-2-(f))
    4. PACRA ensures that the rating assigned to an entity or instrument is not affected by the existence of a business relationship between PACRA and the entity or any other party, or the non-existence of such a relationship. (Chapter III; 12-2-(i))
    5. PACRA ensures that the analysts or any of their family members shall not buy, sell, or engage in any transaction in any security which falls in the analyst’s area of primary analytical responsibility. This clause, however, does not apply to investments in securities through collective investment schemes. (Chapter III; 12-2-(l))
    6. PACRA has established policies and procedures governing investments and trading in securities by its employees and for monitoring the same to prevent insider trading, market manipulation, or any other market abuse. (Chapter III; 11-B-(g))
  5. Monitoring and Review
    1. PACRA monitors all the outstanding ratings continuously, and any potential change therein due to any event associated with the issuer, the security arrangement, the industry, etc., is disseminated to the market immediately and in an effective manner after appropriate consultation with the entity/issuer. (Chapter III; 17-(a))
    2. PACRA reviews all the outstanding ratings periodically on an annual basis. Provided that public dissemination of annual review and in an instance of change in rating will be made. (Chapter III; 17-(b))
    3. PACRA initiates an immediate review of the outstanding rating upon becoming aware of any information that may reasonably be expected to result in downgrading of the rating. (Chapter III; 17-(c))
    4. PACRA engages with the issuer and the debt securities trustee to remain updated on all information pertaining to the rating of the entity/instrument. (Chapter III; 17-(d))
  6. Probability of Default
    1. PACRA’s Rating Scale reflects the expectation of credit risk. The highest rating has the lowest relative likelihood of default (i.e., probability). PACRA’s transition studies capture the historical performance behavior of a specific rating notch. Transition behavior of the assigned rating can be obtained from PACRA’s Transition Study available at our website. (www.pacra.com) However, the actual transition of rating may not follow the pattern observed in the past. (Chapter III; 14-3(f)(vii))
  7. Proprietary Information
    1. All information contained herein is considered proprietary by PACRA. Hence, none of the information in this document can be copied or otherwise reproduced, stored, or disseminated in whole or in part in any form or by any means whatsoever by any person without PACRA’s prior written consent.

Apr-25

www.pacra.com