Rating History
Dissemination Date Long-Term Rating Short-Term Rating Outlook Action Rating Watch
13-Feb-25 A A1 Stable Maintain -
16-Feb-24 A A1 Stable Maintain -
23-Feb-23 A A1 Stable Upgrade -
23-Feb-22 A A2 Stable Upgrade -
25-Aug-21 A- A2 Positive Maintain -
About the Entity

Ahmed Fine Textile Mills Limited, incorporated in 1989, is engaged in the manufacturing and marketing of different varieties of yarn, fabric, and towels. The board of directors comprises seven members. Mr. Rehman Naseem, the CEO, carries with him over two decades of experience in the textile sector. He is supported by a team of highly qualified and seasoned professionals.

Rating Rationale

The ratings of Ahmed Fine Textile Mills Limited (“AFTML” or “the Company”) emerge from its association with Fazal Group, a renowned textile business group with a profound history of operations. The operational infrastructure of AFTML includes spinning, weaving and towel segments accompanied by a total annual production capacity of 40.7mln kgs of yarn, 110.5mln yards of greige fabric and 3.9mln kgs of towels. The Company has undertaken a capital expenditure investment in FY24, installing 1,924 spindles to expand its core business and 14 terry looms as part of its diversification strategy. These enhancements position the Company to meet the growing demand for coarser yarn and terry towels. The Company’s product portfolio comprises various categories of yarn, greige fabric and terry towels. The Company’s topline demonstrated robust growth (FY24: PKR 46.68bln; FY23: PKR 37.03bln), with export and local sales contributing almost equally. In terms of business contribution, weaving is the Company’s foremost segment contributing PKR 31.24bln (FY23: PKR 26.94bln), followed by the spinning segment at PKR 11.36bln (FY23: PKR 6.84bln) and towel segment at PKR 4.07bln (FY23: PKR 3.24bln). The terry towel segment is expanding its presence in the export market and is expected to achieve profitability in the upcoming quarters, contributing to the Company's overall export growth. During 1QFY25, the growth trajectory continued and the Company’s revenue base stood at PKR 12.8bln (1QFY24: PKR 11.8bln). The top customers and suppliers of the Company are well-established and stable entities. Europe is AFTML’s prime export destination, followed by Asia and other regions. The margins witnessed attrition attributed to expensive cotton procurement and escalated energy costs. The management is mindful of energy costs and has already installed a 3.5-megawatt solar which is operational. Further, the installation of a further 7.5-megawatt is still under process, financed through long-term conventional debt which is expected to become operational by the end of FY25. The strategic offloading of PKR 1.5bln short-term conventional borrowings benefitted the profitability matrix of the Company (1QFY25: PKR 336mln; 1QFY24: PKR: 149mln). The Company mainly fuels its working capital requirements through short-term borrowings. The Company has maintained a leveraged capital structure with stretched working capital management. However, the management of the Company is committed to rationalizing its net working capital cycle by optimizing inventory levels and reducing product lead time. The improvement in the coverages will strengthen the Company’s financial risk profile. Looking ahead, the management intends to establish its footprint in the niche market by venturing into a high-potential segment, laser printing on terry towels due to better margins and favorable product pricing.

Key Rating Drivers

The ratings are dependent on the strengthening of business operations under the current economic conditions and an adequate financial risk profile. The optimization of the Company’s cost structure and generation of sufficient cash flows to fulfill its financial obligations remains critical for the assigned ratings.

Profile
Legal Structure

Ahmed Fine Textile Mills Limited ("AFTML" or "the Company") operates as a public unlisted Company under the repealed Companies Ordinance, 1984 (now Companies Act 2017).


Background

AFTML, established in 1989, has evolved into a leading player in the textile industry. Initially, focused solely on the manufacturing of yarn and fabric, the Company has significantly expanded its operations and now it operates as a composite unit. In addition to its core expertise in yarn and fabric production, the Company has diversified its product portfolio by venturing into the terry towel segment.


Operations

The Company boasts an annual production capacity of 83,820 spindles, 492 looms, and 39 terry looms. It operates with two state-of-the-art spinning units, located in Multan and Rahim Yar Khan, accompanied by a consolidated annual production capacity of 40.7 million kilograms of yarn, 110.5 million yards of greige fabric, and 3.9 million kilograms of terry towels. The Company’s weaving unit, situated in Multan, specializes in the production of greige fabric and high-quality export-grade towels. This manufacturing infrastructure enables the Company to meet both domestic and international demand efficiently.


Ownership
Ownership Structure

The Company is a business venture of the sponsors of a renowned business group, Fazal Group. The major shareholding (~84%) of the Company rests with Mian Rehman Naseem while the remaining stake (~16%)  is owned by Mian Hussian Ahmad Fazal.


Stability

The Company’s ownership structure is expected to remain stable in the foreseeable future, as evidenced by the transfer of a significant stake to Mian Rehman Naseem, establishing a clear and structured line of succession. Moving forward, the transfer of the remaining shares to Mian Rehman Naseem is expected to culminate by the end of FY25, ensuring a seamless transition of ownership.


Business Acumen

Fazal Group has a longstanding history within the country's economy, further strengthened by its five decades of presence in the local textile industry. The group has weathered several economic cycles over the years, yet its growth has remained intact, enabling the sponsors to navigate the industry's volatility.


Financial Strength

The financial strength of the sponsoring group emanates from its one additional Company operating in the textile domain; Fazal Cloth Mills Limited with a topline of ~PKR 97bln. The strategic investments in the fertilizer and textile sectors at the group level depict the strong financial capacity of the sponsors to support the Company if needed.


Governance
Board Structure

The Company's board is dominated by the sponsoring family. The overall control of the board is vested with seven members, including the Chairman and the Chief Executive Officer. The inclusion of an independent oversight will enhance the governance framework of the Company.


Members’ Profile

The Chairman, Mr. Sheikh Naseem, brings over five decades of experience in the textile industry. He serves as the key decision-maker at Fazal Cloth Mills Limited and holds directorships at other group companies. Mr. Abdullah Amir Fazal has three years of experience in the textile industry and has been a member of the Company's board since 2019. Mr. Naveed Amer, who holds a Master's degree in Business Administration, has been associated with the Company for approximately twenty-six years. Mr. Haziq Fazal, Ms. Atiqa Hussain and Ms. Minahil Fazal have been serving on the Company's board since 2019.  


Board Effectiveness

The Company has formed an Audit Committee to assist the board in addressing critical financial and regulatory matters. Additionally, the attendance of members at BOD meetings remained strong, with minutes meticulously recorded to capture key discussions and decisions. 


Financial Transparency

To uphold high standards of transparency, the Company has an internal audit department in place that reports to the CEO. M/s Yousuf Adil & Co. Chartered Accountants have been appointed as the external auditors of the Company rated in "Category A" by the SBP panel of auditors. They expressed an unqualified opinion on the financial statements of the Company for the year ended June 2024.


Management
Organizational Structure

The management control of the Company vests with Fazal Group, through Mr. Rehman Naseem serving as the CEO of the Company. The Company's organizational structure has been divided into five functional departments to ensure the smooth flow of operations.


Management Team

Mr. Rehman Naseem, the Chief Executive Officer, is a graduate of Columbia University and brings more than two decades of experience in the textile industry. The Company also benefits from a team of seasoned professionals with long-standing tenure, contributing to its sustainable growth prospects. Mr. Naveed Amer, serving as the Chief Financial Officer holds a master's degree in Business Administration and brings with him over three decades of experience in the textile industry.


Effectiveness

The management meetings are conducted on a periodic basis which ensures accountability. In addition to these scheduled meetings, ad-hoc meetings are held as needed to address specific bottlenecks and troubleshoot any operational challenges. This approach ensures that both routine oversight and urgent concerns are effectively managed.


MIS

For comprehensive reporting, the Company has implemented an Oracle-based Enterprise Resource Planning (ERP) system, which is regularly updated and includes various operational modules.


Control Environment

AFTML is accredited with various international certifications for compliance. The Company is following the latest Quality Assurance Standards for yarn and fabric production. A few of the prominent certifications include ISO 9001, Lycra assured, and Fair Trade.


Business Risk
Industry Dynamics

Textile exports of the country reached USD 16.7bln in FY24, a slight increase from USD 16.5bln in the previous year, reflecting a growth of 0.93% YoY. The highest contribution came from the composite and garments segment at USD 9.1bln, followed by the weaving segment at USD 6.5bln and the spinning segment at USD 1.0bln. In FY25, the transition from the final tax regime to the normal tax regime is set to impact the profitability matrix of export-oriented units, with a 29% tax on profits and a super tax of up to 10%.


Relative Position

AFTML falls in the mid-tier of the respective industry with a total production capacity of 83,820 spindles, 492 fabric looms and 39 towel looms.


Revenues

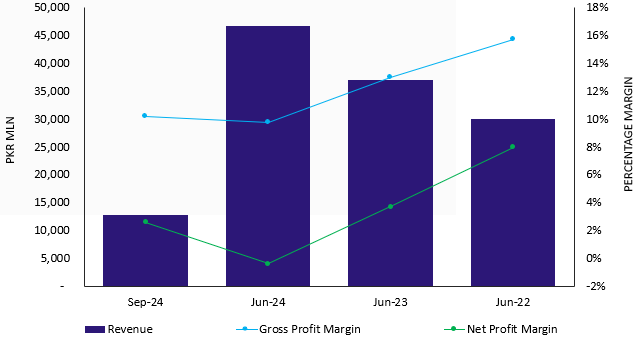
During FY24, the Company's topline exhibited remarkable growth reaching PKR 46.6bln (FY23: PKR 37.0bln) followed by a three-year CAGR of 16.3% from 2022 to 2024. The Company's sales mix remained largely the same. The export sales experienced an upswing (FY24: PKR 26.5bln; FY23: PKR 19.0bln), dominated by fabric sales, which constitute around 73% followed by towels and yarn. The Company's export destinations for all three segments (spinning, weaving, and towel) include Portugal, Singapore, Italy, Switzerland, Turkey, Romania, France, etc. The Company has established a stable customer base around the globe indicative of a low geographic concentration risk. The Company's top 20 client concentration for exports remained moderate, however, the long association of the Company with stable entities provides comfort. The local sales have a contribution of approximately 46.4% recorded at PKR 21.6bln (FY23: PKR 18.4bln). During 1QFY25, the Company's topline posted a sizeable improvement reported at PKR 12.8bln (1QFY24: PKR 11.8bln) indicating an uptick of 8.1% on a quarter-on-quarter basis.


Margins

During FY24, the Company's gross profit margin witnessed a dip at 9.8% (FY23: 13.0%) primarily due to a progression in raw material prices and escalated energy cost. The Company maintained its GP margin through strategic adjustments in the product mix towards higher-demand products such as coarse yarn and grey fabric. The operating expenses surged by 36.3% on a year-on-year basis at PKR 1.3bln (FY23: PKR 979mln) concomitant with the inflationary trends. The Company's operating profit margin stood at 6.9% (FY23: 10.4%). The profit before interest and taxes was contracted to PKR 3.8bln (FY23: PKR 4.6bln) on the back of a slump in the exchange gain compared to the corresponding period. The higher interest rates resulted in a massive increase in the finance cost (FY24: PKR 3.6bln; FY23: PKR 2.7bln). Consequently, the Company's bottom line recorded a net loss of PKR 188mln against the net profitability of PKR 1.3bln in FY23. During 1QFY25, the Company's gross profit margin inched up to 10.2% (1QFY24: 12.4%) attributed to an improvement in the revenue base. The gradual decrease in the interest rates led to an uptick in the net profitability (1QFY25: PKR 336mln; 1QFY24: PKR 149mln) with the net profit margin of 2.6% (1QFY24: 1.3%) 


Sustainability

In FY24, the Company resumed its expansion initiative, aiming to enhance its spinning production capacity by adding 50,000 spindles. This expansion was carried out in two phases and has now been completed. The Company has successfully installed a 3.5 megawatt solar power system which is currently operational. Further, the installation of a 7.5 megawatt solar is still under process with plans underway to install an additional 10 megawatt solar to curb the impact of escalated energy costs. In the coming years, the management plans to strategically invest in advanced laser printing technology over the coming years. This investment is aimed at enhancing production capabilities and enabling the Company to meet evolving market demand. The adoption of laser printing technology is expected to support innovation in product offerings, reduce costs, and strengthen the Company's competitive edge in the industry.


Financial Risk
Working capital

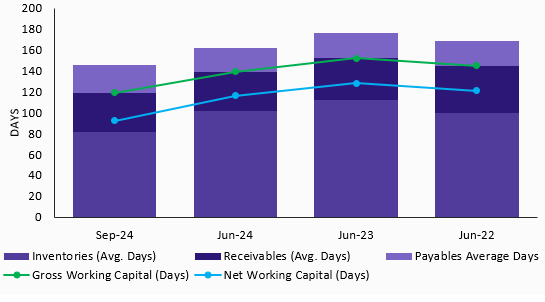
The Company's working capital cycle is a function of inventory days and trade receivables days for which the Company mainly relies on short-term borrowings. During 1QFY25, the net working capital cycle improved to 91 days (FY24: 115 days) attributed to a decline in the inventory cycle (1QFY25: 81 days; FY24: 102 days), however, the elevated payable cycle reflects that the delay in payments to the suppliers. The Company holds a limited borrowing capacity as illustrated by the short-term trade leverage reported at 27.8% (FY24: 27.5%).


Coverages

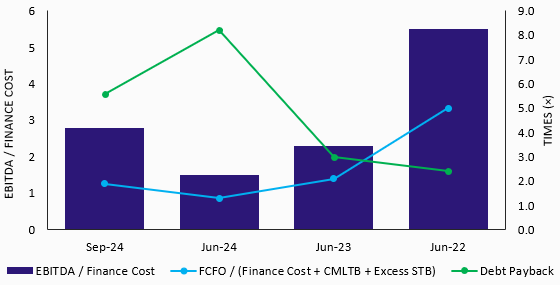
The dilution in PBT ultimately impacted the Company's Free Cash Flows from Operations (FCFO) reported at PKR 988mln (FY24: PKR 4.8bln). With the decrease in funding cost and FCFO, the Company's interest coverage exhibited a minute improvement and stood at 1.9x (FY24: 1.3x) whereas the core operating coverage remained largely the same at 1.0x (FY24: 0.9x). Going forward, the improvement in the coverages of the Company remains essential.


Capitalization

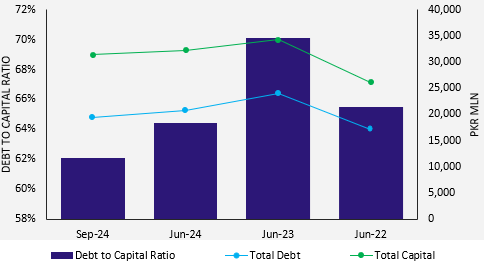
The Company's debt profile comprises subsidized borrowings by the State Bank of Pakistan (SBP) as well as conventional borrowings. The Company secured long-term subsidized loans specifically aimed at achieving the targeted production capacity in its spinning and towel segments. The Company has maintained a leveraged capital structure mainly dominated by short-term borrowings (STBs) to meet the extensive working capital requirements which account for 45.7% of the borrowing book. During 1QFY25, the total leveraging went down to 62.1 %, compared to 64.4% as of FY24. However, the Company’s equity base was enhanced to PKR 11.9bln (FY24: PKR 11.4bln), with an unappropriated profit of PKR 10.9bln, demonstrating the Company's ability to maintain its financial position despite the higher borrowing levels.


Feb-25

www.pacra.com


Sep-24
3M
Jun-24
12M
Jun-23
12M
Jun-22
12M
Management Audited Audited Audited
A. BALANCE SHEET
1. Non-Current Assets 15,539 15,836 15,786 13,778
2. Investments 2,623 2,144 1,440 1,841
3. Related Party Exposure 0 0 0 0
4. Current Assets 20,020 20,982 23,420 15,503
a. Inventories 10,971 11,674 14,361 8,289
b. Trade Receivables 5,431 5,163 4,285 3,735
5. Total Assets 38,182 38,962 40,646 31,122
6. Current Liabilities 6,336 5,723 5,742 4,465
a. Trade Payables 4,466 3,105 2,835 1,991
7. Borrowings 19,484 20,736 24,054 17,101
8. Related Party Exposure 0 0 0 0
9. Non-Current Liabilities 462 1,032 607 532
10. Net Assets 11,900 11,471 10,243 9,024
11. Shareholders' Equity 11,900 11,471 10,243 9,024
B. INCOME STATEMENT
1. Sales 12,830 46,683 37,030 30,126
a. Cost of Good Sold (11,524) (42,130) (32,217) (25,396)
2. Gross Profit 1,305 4,553 4,813 4,729
a. Operating Expenses (391) (1,335) (979) (998)
3. Operating Profit 914 3,218 3,834 3,731
a. Non Operating Income or (Expense) 118 662 780 139
4. Profit or (Loss) before Interest and Tax 1,032 3,880 4,615 3,870
a. Total Finance Cost (530) (3,687) (2,798) (935)
b. Taxation (166) (381) (444) (530)
6. Net Income Or (Loss) 336 (188) 1,373 2,405
C. CASH FLOW STATEMENT
a. Free Cash Flows from Operations (FCFO) 988 4,849 5,558 4,240
b. Net Cash from Operating Activities before Working Capital Changes 409 990 3,425 3,443
c. Changes in Working Capital 1,698 2,827 (7,235) (5,648)
1. Net Cash provided by Operating Activities 2,107 3,817 (3,810) (2,205)
2. Net Cash (Used in) or Available From Investing Activities (447) (712) (3,142) (7,369)
3. Net Cash (Used in) or Available From Financing Activities (1,840) (2,846) 6,953 9,443
4. Net Cash generated or (Used) during the period (180) 259 0 (131)
D. RATIO ANALYSIS
1. Performance
a. Sales Growth (for the period) 9.9% 26.1% 22.9% 0.0%
b. Gross Profit Margin 10.2% 9.8% 13.0% 15.7%
c. Net Profit Margin 2.6% -0.4% 3.7% 8.0%
d. Cash Conversion Efficiency (FCFO adjusted for Working Capital/Sales) 20.9% 16.4% -4.5% -4.7%
e. Return on Equity [ Net Profit Margin * Asset Turnover * (Total Assets/Shareholders' Equity )] 11.5% -1.7% 14.2% 53.3%
2. Working Capital Management
a. Gross Working Capital (Average Days) 118 139 151 146
b. Net Working Capital (Average Days) 91 115 127 122
c. Current Ratio (Current Assets / Current Liabilities) 3.2 3.7 4.1 3.5
3. Coverages
a. EBITDA / Finance Cost 2.8 1.5 2.2 5.5
b. FCFO / Finance Cost+CMLTB+Excess STB 1.0 0.9 1.4 2.4
c. Debt Payback (Total Borrowings+Excess STB) / (FCFO-Finance Cost) 5.6 8.2 3.1 2.4
4. Capital Structure
a. Total Borrowings / (Total Borrowings+Shareholders' Equity) 62.1% 64.4% 70.1% 65.5%
b. Interest or Markup Payable (Days) 81.7 51.8 108.5 100.7
c. Entity Average Borrowing Rate 9.1% 15.3% 12.9% 8.3%

Feb-25

www.pacra.com

Feb-25

www.pacra.com

  1. Rating Team Statements
    1. Rating is just an opinion about the creditworthiness of the entity and does not constitute a recommendation to buy, hold, or sell any security of the entity rated or to buy, hold, or sell the security rated, as the case may be. (Chapter III; 14-3-(x))
    2. Conflict of Interest
      1. The Rating Team or any of their family members have no interest in this rating (Chapter III; 12-2-(j))
      2. PACRA, the analysts involved in the rating process, and members of its rating committee and their family members do not have any conflict of interest relating to the rating done by them (Chapter III; 12-2-(e) & (k))
      3. The analyst is not a substantial shareholder of the customer being rated by PACRA [Annexure F; d-(ii)]
      4. Explanation: for the purpose of the above clause, the term "family members" shall include only those family members who are dependent on the analyst and members of the rating committee.
  2. Restrictions
    1. No director, officer, or employee of PACRA communicates the information acquired by him for use for rating purposes to any other person, except where required under law to do so. (Chapter III; 10-(5))
    2. PACRA does not disclose or discuss with outside parties or make improper use of the non-public information which has come to its knowledge during a business relationship with the customer. (Chapter III; 10-7-(d))
    3. PACRA does not make proposals or recommendations regarding the activities of rated entities that could impact a credit rating of the entity subject to rating. (Chapter III; 10-7-(k))
  3. Conduct of Business
    1. PACRA fulfills its obligations in a fair, efficient, transparent, and ethical manner and renders high standards of services in performing its functions and obligations. (Chapter III; 11-A-(a))
    2. PACRA uses due care in the preparation of this Rating Report. Our information has been obtained from sources we consider to be reliable, but its accuracy or completeness is not guaranteed. PACRA does not, in every instance, independently verify or validate information received in the rating process or in preparing this Rating Report. (Clause 11-(A)(p))
    3. PACRA prohibits its employees and analysts from soliciting money, gifts, or favors from anyone with whom PACRA conducts business. (Chapter III; 11-A-(q))
    4. PACRA ensures before the commencement of the rating process that an analyst or employee has not had a recent employment or other significant business or personal relationship with the rated entity that may cause or may be perceived as causing a conflict of interest. (Chapter III; 11-A-(r))
    5. PACRA maintains the principle of integrity in seeking rating business. (Chapter III; 11-A-(u))
    6. PACRA promptly investigates in the event of misconduct or a breach of the policies, procedures, and controls, and takes appropriate steps to rectify any weaknesses to prevent any recurrence, along with suitable punitive action against the responsible employee(s). (Chapter III; 11-B-(m))
  4. Independence & Conflict of Interest
    1. PACRA receives compensation from the entity being rated or any third party for the rating services it offers. The receipt of this compensation has no influence on PACRA’s opinions or other analytical processes. In all instances, PACRA is committed to preserving the objectivity, integrity, and independence of its ratings. Our relationship is governed by two distinct mandates: i) rating mandate - signed with the entity being rated or issuer of the debt instrument, and ii) fee mandate - signed with the payer, which can be different from the entity.
    2. PACRA does not provide consultancy/advisory services or other services to any of its customers or their associated companies and associated undertakings that are being rated or have been rated by it during the preceding three years, unless it has an adequate mechanism in place ensuring that the provision of such services does not lead to a conflict of interest situation with its rating activities. (Chapter III; 12-2-(d))
    3. PACRA discloses that no shareholder directly or indirectly holding 10% or more of the share capital of PACRA also holds directly or indirectly 10% or more of the share capital of the entity which is subject to rating or the entity which issued the instrument subject to rating by PACRA. (Chapter III; 12-2-(f))
    4. PACRA ensures that the rating assigned to an entity or instrument is not affected by the existence of a business relationship between PACRA and the entity or any other party, or the non-existence of such a relationship. (Chapter III; 12-2-(i))
    5. PACRA ensures that the analysts or any of their family members shall not buy, sell, or engage in any transaction in any security which falls in the analyst’s area of primary analytical responsibility. This clause, however, does not apply to investments in securities through collective investment schemes. (Chapter III; 12-2-(l))
    6. PACRA has established policies and procedures governing investments and trading in securities by its employees and for monitoring the same to prevent insider trading, market manipulation, or any other market abuse. (Chapter III; 11-B-(g))
  5. Monitoring and Review
    1. PACRA monitors all the outstanding ratings continuously, and any potential change therein due to any event associated with the issuer, the security arrangement, the industry, etc., is disseminated to the market immediately and in an effective manner after appropriate consultation with the entity/issuer. (Chapter III; 17-(a))
    2. PACRA reviews all the outstanding ratings periodically on an annual basis. Provided that public dissemination of annual review and in an instance of change in rating will be made. (Chapter III; 17-(b))
    3. PACRA initiates an immediate review of the outstanding rating upon becoming aware of any information that may reasonably be expected to result in downgrading of the rating. (Chapter III; 17-(c))
    4. PACRA engages with the issuer and the debt securities trustee to remain updated on all information pertaining to the rating of the entity/instrument. (Chapter III; 17-(d))
  6. Probability of Default
    1. PACRA’s Rating Scale reflects the expectation of credit risk. The highest rating has the lowest relative likelihood of default (i.e., probability). PACRA’s transition studies capture the historical performance behavior of a specific rating notch. Transition behavior of the assigned rating can be obtained from PACRA’s Transition Study available at our website. (www.pacra.com) However, the actual transition of rating may not follow the pattern observed in the past. (Chapter III; 14-3(f)(vii))
  7. Proprietary Information
    1. All information contained herein is considered proprietary by PACRA. Hence, none of the information in this document can be copied or otherwise reproduced, stored, or disseminated in whole or in part in any form or by any means whatsoever by any person without PACRA’s prior written consent.

Feb-25

www.pacra.com