Profile
Legal Structure
Maqbool Textile Mills Limited (`MTML' or 'the Company') was incorporated in Pakistan on December 03, 1989, as a public limited
company under the repealed Companies Ordinance, 1984 (now Companies Act, 2017) and is listed on the Pakistan Stock
Exchange.
Background
Maqbool Group started operations in 1958, with the incorporation of a yarn spinning unit — Allawasaya Textiles & Finishing Limited. At present, the group
has main interests in textile and seed oil extraction businesses. It was set up by the Maqbool family, a well-reputed business family of industrialists in Multan.
Operations
The Company is engaged in cotton ginning, manufacturing, and sale of yarn, cotton seed, and cotton lint. The company operates with four spinning units installed at Muzaffargarh (Unit I, II, and IV), and Tobatek Singh (Unit III), having a total operational capacity
of 82,224 spindles (at Unit 1,2 & 3) and 576 MSV installed spindles (at unit-4) which equivalent to ~12,000 conventional spindles. The current energy requirement of the Company stood at 7 megawatts, which is primarily met through internally installed solar capacity, and electricity. The Company's registered office is located at 2-Industrial Estate Multan, Pakistan
Ownership
Ownership Structure
The sponsoring family holds a majority stake in the Company (65.1%) through group companies (9.8%) and individual holdings (55.3%), while
the remaining shares are held by the general public (34.9%),
Stability
The second generation of the family has already been in business, serving in various capacities. No change in the ownership structure is anticipated in the foreseeable future. Furthermore, a formal succession plan will further improve the ownership profile of the Company.
Business Acumen
MTML is one of the longest-established textile houses and has been operating under the Mian Tanveer Ahmed Sheikh for over three decades. Over this period, the company has developed significant expertise in spinning and successfully expanded its operations, demonstrating resilience and adaptability within the highly competitive textile industry.
Financial Strength
Maqbool Group has also invested in Oil Extraction, Flour Milling, and various other trading businesses. Mehmooda Maqbool Mills Limited, one of the group companies has a top line of PKR 13.5bln as of FY24. As the flagship Company of its sponsors, it benefits from unwavering support when required.
Governance
Board Structure
MTML's board comprises ten
members. Seven members are from the sponsoring family. Four members are
non-executive directors, three directors carry the executive role and three are
independent directors. Ms. Romana Tanvir Sheikh serves the role of Chairperson.
The inclusion of independent oversight has strengthened the governance matrix
of the Company.
Members’ Profile
Mr. Mian Tanvir Ahmed Sheikh is the Company's Chief Executive Officer. Tanvir Ahmad Sheikh is the renowned Industrialist of the Country having a Master‘s Degree in Business Administration from OHIO University, U.S.A. He has been quite successfully running the Complex Industrial Units of his Group since 1981. Mian Anis Ahmad Shiekh and Mian Atta Shafi Tanvir Sheikh occupy the executive roles on the board along with the CEO. Both directors have extensive experience in the textile sector.
Board Effectiveness
The Board is supported by two specialized committees: (i) the Audit Committee and (ii) the HR & Remuneration Committee, which provide assistance on relevant governance matters. To ensure effective oversight and decision-making, board meetings are held regularly, with formal documentation of meeting minutes maintained.
Financial Transparency
M/s. Yousaf Adil & Co. Chartered Accountants are the external auditors of the Company. The auditors have issued an unqualified opinion on the
Company's financial statements for the period ending June 30th, 2024.
Management
Organizational Structure
The organizational structure of the Company is divided into five main functions, namely i) Sales & Marketing, ii) Procurement, iii) Admin &
Finance, iv) Production, v) IT. All operational departments report directly to the CEO, while the procurement department reports to the CEO and chairperson simultaneously.
Management Team
The current CEO of the Company, Mr. Mian Tanvir Ahmed Sheikh has been associated with the company since its inception. Mr. Tanvir is a distinguished industrialist with a Master's degree in Business Administration from Ohio University, USA. He has been successfully managing a group of industrial units since 1981. Mr. EhsanUllah Khan holds the position of CFO in the Company. He holds an MBA degree and has been associated with the Company for the last two decades.
Effectiveness
The management meetings are held daily with follow-up points to resolve or proactively address operational issues, if any, eventually ensuring a smooth flow of operations. However, no management committees exist and the establishment will augment the management profile of the Company.
MIS
The Company's operating environment depends upon an IT Infrastructure supported by an in-house programmed ERP. The IT system is fully integrated into all
major departments and ensures proper financial and operational control. Daily reports include cash and bank position, stock consumption, per-spindle cost, receivables,
and inventory status while monthly production accounts are also maintained.
Control Environment
Production is completely order-driven to avoid stock pile-ups. There is a quality control department in place to audit the quality of the output. HSE
infrastructure seems appropriate and is emphasized. The Company has adequate relevant quality control standards to meet export requirements. The Company has in-house internal audit department. The head of internal audit is reportable to the CFO.
Business Risk
Industry Dynamics
The textile exports of the country reached USD 16.7bln in FY24, a slight increase from USD 16.5bln in the previous year, reflecting a growth of 0.93% YoY. The highest contribution came from the composite and garments segment at USD 9.1bln, followed by the weaving segment at USD 6.5bln and the spinning segment at USD 1.0bln. During 5MFY25, the textile exports stood at USD 7.6bln. In FY25, the transition from the final tax regime to the normal tax regime is set to impact the profitability matrix of export-oriented units, with a 29% tax on profits and a super tax of up to 10%. The consistent decline in policy rates over the last two quarters, along with the anticipation of further reductions, is expected to provide a cushion in the financial metrics of the industry.
Relative Position
The Maqbool family has been associated with the textile business since 1958. However, as a group and on a stand-alone basis, their market share in the
spinning sector is moderate. The company has installed a capacity of 82,224 spindles along with 576 MVS spindles in its production facilities. Considering the the existing capacity, the Company is considered a mid tier player in the Spinning segment.
Revenues
A major portion of the Company’s topline is generated through local sales. While the remaining portion is derived from the export sales. During FY24, the
Company’s revenue base portrayed a marginal improvement at PKR 10.3bln (FY23: PKR 9.8bln) up by 5% YoY. The sales mix tilted towards the local market.
The Company’s export sales indicated a substantial increase on a YoY basis recorded at PKR 1.6bln (FY23: PKR 376mln). The local sales indicated a sizable decline of 11.5%, clocking at PKR 9.8bln (FY23: PKR 11.1bln). During 1QFY25, the Company's sales base clocked to PKR 1.7bln (1QFY24: PKR 3.1bln) due to a drop in local yarn demand, as imports served as a substitute, coupled with unfavorable pricing dynamics.
Revenues
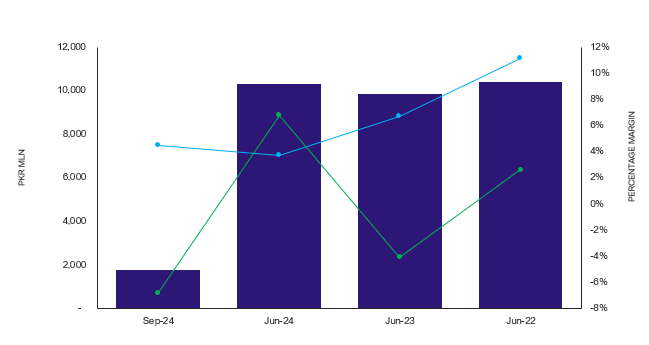
Margins
During FY24, the company’s gross margins decreased to 3.7% (FY23: 8.2%) attributable to the elevated energy cost of the Company(FY24: PKR 2.4bln, FY23: PKR 1.3bln) as energy cost to sales ratio witnessed significant incline to 23.5%(FY23: 13.4%) This translated into declined operating margins clocking in at 0.3% (FY23: 4.5%). Finance cost increased to stand at PKR 767mln (FY23: PKR 633mln). The company's net loss stood at PKR 698mln (FY23: PKR 250mln (loss)) owing to the high cost of production and high finance costs. Subsequently, the net margin decreased (FY24: -6.8%, FY23: -4.1%). During 1QFY25, the company’s gross margins declined to 4.5% (1QFY24: 11.2%). Net margin further decreased to -11.3% (1QFY24: 1.3%)
Sustainability
The company is actively pursuing sustainability by enhancing operational efficiency and profitability through regular Balancing, Modernization, and Replacement (BMR) initiatives. Additionally, the company is strategically reducing its energy costs by transitioning from WAPDA to solar power as energy costs constitute the primary risk factor for the sustainability of the Company’s cost structure, as evidenced by an 83.16% increase in power and fuel expenses, which has a significant impact on profitability.
Financial Risk
Working capital
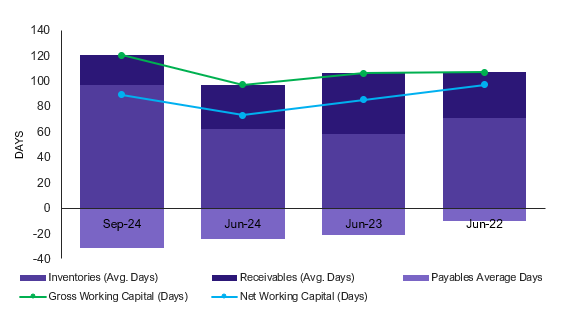
At the end of Sept 24, the company's net working capital cycle extended to 90 days (Jun'24: 79 days, Jun'23: 85 days), mainly on account of higher inventory days
(Sep'24: 97 days; Jun'24: 68 days). Trade assets of the Company indicated a sizable decline (Sep'24: PKR 3,081mln; Jun'24: PKR 3,356mln, Jun'23: PKR 3,684mln) The Company's short-term trade leverage stood at -17.8% (Jun'24: 21.4%).
Working Capital Management
Coverages
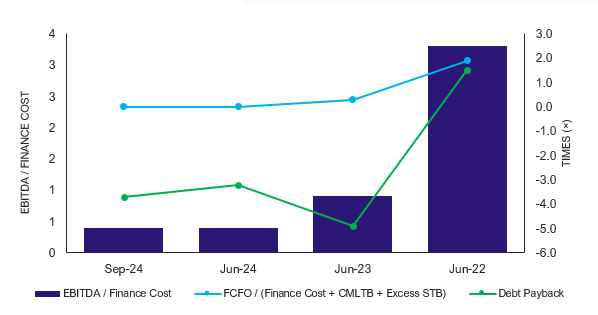
During FY24, the Company's free cash flow from operations (FCFO) sizably decreased (FY24: PKR 111mln, FY23: PKR 379mln). Interest coverage declined (FY24: 0.0x; FY23: 0.6x) driven by the declined FCFOs and inclined finance cost. Likewise, debt coverage also declined (FY24: 0.0x; FY23: PKR 0.6x). During 1QFY25, the Company's FCFO diluted down to PKR 11mln, indicating stress on the Company's coverages.
Coverages
Capitalization
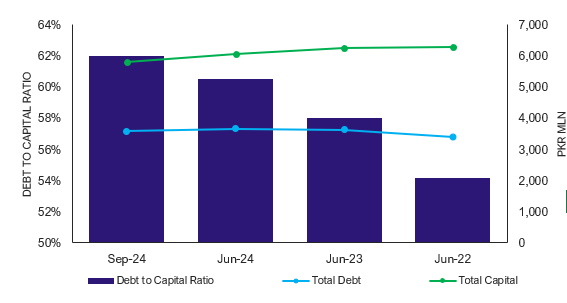
At end-Sep24, the company's capital structure remained highly leveraged at 62% (FY24: 60.5%) as the total borrowings decreased (1QFY25: PKR
3,593mln; FY24: PKR 3,666mln). The short-term borrowing constituted 75.8% (FY24: 82.9%) of the total borrowings and stood at PKR 2,723mln(FY24: PKR 3,040mln). The equity base of the company decreased to stand at PKR 2,205mln (Jun'24: PKR 2,389mln), mainly supplemented by the evaluation of fixed assets(FY24: PKR 2,091mln, FY23: PKR 1,581mln). The dilution in the equity base is attributable to the consistent losses sustained over two years, impacting the Company's reserves.
Capital Structure
|
