Profile
Legal Structure
Samad Rubber Works (Pvt.) Limited (‘SRW’ or ‘the Company’) is a private limited entity incorporated in 1962 under the Companies Act, 1913 (now the Companies Act, 2017). The Company’s registered office is located at 409-Ferozepur Road, Lahore.
Background
Mr. Abdus Samad (Late) laid the foundation of “Samad Group of Industries” in 1948. He incorporated Pakistan Rubber Industries and started the production of industrial and commercial rubber hoses. By the 1950s, the group had launched Pakistan’s largest latex foam mattress manufacturing unit. In 1958, it established a shoe manufacturing unit in collaboration with an Austrian firm. After the family business split, Mr. Abdus Samad launched the adhesive brand SAMAD BOND in 1965. Between the 1970s and 1990s, the Company developed high-performance military products for the Pakistan Armed Forces. In the late 2000s, the Company began producing and selling technical textile products. In 2009, Samad Apparel was introduced, followed by the launch of Samad Outerwear and Personal Protective Equipment (PPEs) in 2020.
Operations
The Company is primarily involved in the manufacturing & sale of polymer-based and textile products. Over the years, the Samad Group has built different Strategic Business Units (SBUs) by introducing multiple products under each umbrella - Apparel, Foam, Adhesives, Defense, & Technical Textiles. The Main Unit, which encompasses the adhesive and foam segments, has a production capacity of 9,264 tons and achieved a utilization rate of ~83%. Similarly, the Denim Unit, which includes the apparel and outerwear segments, has a production capacity of 3,144,000 pieces and achieved a utilization rate of ~78%. These figures indicate that while the company effectively utilizes a significant portion of its production capabilities, there is still room for optimization to reach full capacity. Notably, the defense segment operates based on specific orders or tenders, aligning production capacities with demand.
Table 1: Capacity and Production

Ownership
Ownership Structure
SRW is wholly owned by the sponsoring family, with Mr. Abdul Sami holding ~60% and Mr. Fazal Haq holding ~40%. This concentrated ownership structure highlights their strong commitment to long-term value creation and rigorous performance monitoring. However, it also indicates potential biases in decision-making and a limited range of viewpoints.
Stability
The Company’s ownership structure seems stable, with no significant changes anticipated, as the sponsoring family holds ~100% of the stake. However, establishing a clearly defined and streamlined shareholding pattern among family members, along with a formal documented succession plan, could further enhance the company’s stability and governance.
Business Acumen
The sponsoring family is renowned for its strong business acumen, backed by extensive industry knowledge and experience. With over 70 years of operational excellence in Pakistan, the group has diversified its portfolio by expanding into various SBUs. This long-standing presence and diversification underline their capability and commitment to sustained growth.
Financial Strength
The Company’s prominent strategic business units (SBUs), including Samad Bond, Samad Foam, and Samad Apparel—maintain strong financial profiles and have substantial access to diversified markets. This reflects the sponsors’ robust capability to provide support when needed, showcasing their economic and financial resilience with strategic market positioning.
Governance
Board Structure
SRW’s board comprises two members, including Mr. Fazal Haq as the Chairman and Mr. Abdul Sami as the Chief Executive Officer (CEO). Notably, there are no independent directors, leading to a board dominated by the sponsoring family. This raises concerns about the lack of independent oversight and challenges to management, which could impede effective governance.
Members’ Profile
The business benefits significantly from the extensive experience and industry expertise of its key members. Mr. Abdul Sami, the CEO, boasts over 30 years of expertise in the defense and foam manufacturing industries. Mr. Fazal Haq, the Chairman, has over 40 years of experience managing one of the oldest and pioneering adhesive manufacturing industries, with substantial expertise in chemical formulations. Additionally, Mr. Arshian Mehboob, the Chief Financial Officer (CFO), brings over 30 years of relevant experience. This year, he has also been appointed as Deputy CEO, where he leads the committees and oversees the transition of the family business to the third generation. This leadership team is bolstered by a team of experienced professionals with significant industry exposure, ensuring robust governance and strategic direction.
Board Effectiveness
The Company has recently established a dedicated board committee, comprising both BODs and 3rd Generation members, to independently address matters across all Strategic Business Units (SBUs) and to involve them more actively in the Company’s decision-making processes. Board meetings are held regularly, with satisfactory member attendance, and minutes are meticulously recorded, reflecting positively on the Company’s governance structure. Additionally, this year, the Company has formed a separate department specifically focused on corporate governance, further enhancing its commitment to robust governance practices and ensuring a smooth family transition phase.
Financial Transparency
M/s. Viqar A. Khan & Co., Chartered Accountants, a QCR-rated firm not classified under 'A' category of the SBP auditors' panel, serves as the external auditor for the company. The auditors provided an unqualified audit opinion on the financial statements for the year ended June 30th, 2024, indicating their satisfaction with the Company’s financial reporting and adherence to accounting standards.
Management
Organizational Structure
The company has a well-defined, multi-layered, and centralized organizational structure, with all key positions filled. At the first tier, the Chief Operating Officer (COO), Chief Financial Officer (CFO), and the Heads of all SBUs report directly to the CEO. In the second tier, functions such as Finance & Accounts, Human Resource Administration, Marketing & Sales, Material Sourcing, Production, Supply Chain, and Information Technology indirectly report to the Deputy CEO assisted by the Corporate Governance Department. Each SBU is led and monitored by a member of the 3rd Generation of the sponsoring family. To support the Heads of all SBUs, the COO functions as a professional liaison for all the divisions, providing strategic guidance and oversight. This structure ensures efficient decision-making, robust oversight across all business units, and strategic alignment of company objectives.
Figure 1: Structure

Management Team
Mr. Abdul Sami, the CEO (MD), has been associated with the Company since its inception. He has played a significant role in contributing to the Company’s stability across various segments, including adhesives, foam, apparel, defense, and technical textiles. He is supported by a team of experienced professionals with extensive industry expertise. Key members include Mr. Waqar-ul-Haq (Head of Defense SBU), Ms. Hasna Sami (Head of Foam SBU), Mr. Abdul Basit (Head of Adhesives SBU), Ms. Izza Sami (Head of Apparel SBU), Ms. Hajra Sami (Head of Technical Textile SBU), Mr. Arshian Mahboob (Deputy CEO/CFO), Mr. Manzoor Hussain Nadeem (COO), Mr. Zahid Abbas (GM HR), Mr. Muhammad Aslam (GM Production), Mr. Saqib Ali (VP Apparel), Mr. Waheed Afzal (VP Sales & Marketing), and Mr. Nouman Jehangir (DGM Finance). This robust team ensures strong leadership and operational continuity.
Effectiveness
With the support of an experienced team of professionals, SRW is building up its business strengths and increasing its footprint across different cities in Pakistan and abroad. The functions of the management are clear and well-documented to achieve its underlying goals and objectives. Further, three management committees; i) Fixed Assets, ii) Vendor Evaluation, and iii) Internal Audit, are in line to ensure effective management control.
MIS
The Company currently utilizes SAP B1 for Hanna version 9.2, in conjunction with Microsoft Power BI version 2.102.845.0. This combination of robust software solutions ensures efficient data management and insightful business analytics, supporting informed decision-making and operational efficiency.
Control Environment
SRW has strengthened its control environment by outsourcing its internal audit function to PKF F.R.A.N.T.S., Chartered Accountants. This enables the Company to have an effective mechanism for the identification, assessment, and reporting of all types of risks arising out of the routine business operations. This strategic move ensures comprehensive compliance at all levels, enhancing the Company’s oversight, transparency, and governance framework.
Business Risk
Industry Dynamics
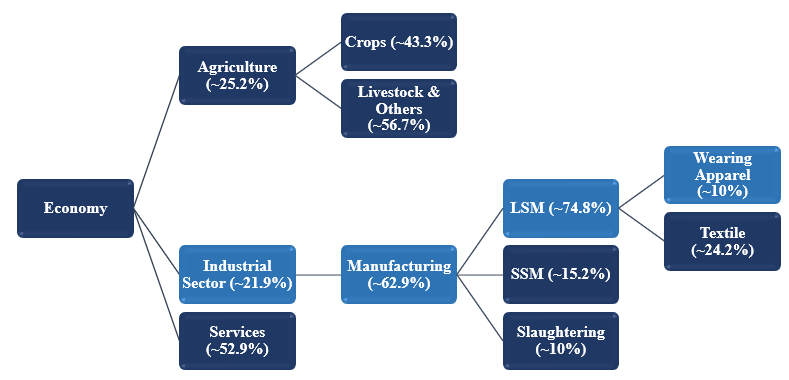
In FY24, Pakistan’s gross domestic product (GDP-nominal) stood at PKR~106.0trn (FY23: PKR~83.9trn), increasing, in real terms, by ~2.4% YoY (FY23: ~-0.21% growth). Industrial activities in FY24 held ~21.9% share in the GDP while manufacturing activities made up ~62.9% of the value addition. Large-scale manufacturing (LSM) in Pakistan is essential for economic growth considering its linkages with other sectors, as it represented ~72.9% value of the manufacturing activities in FY24. The textile sector is classified as an LSM industrial component within the industrial sector. In FY24, the textile industry’s weight in the quantum index of manufacturing (QIM) was recorded at ~24.2% while Wearing Apparel recorded an ~8% YoY increase during the year. According to the Pakistan Bureau of Statistics (PBS), Pakistan’s textile group exports were valued at $16.655bln in FY24 compared to $16.501bln in FY23, reflecting a meager growth of ~0.93% in FY24. Value-added products such as knitwear, bedwear, towels, and ready-made garments accounted for ~71% in FY24 in overall textile exports. Pakistan’s adhesive industry is highly unorganized, comprised of multiple small-sized players, driving its demand from a wide range of sectors, thus impacting SRW’s position in the market differently. It is well-recorded that Pakistan is one of the world’s largest football manufacturers and suppliers, triggering demand in the local unicellular closed-cell foam industry.
Chart 1: GDP Contribution

Relative Position
SRW is a prominent player in Pakistan’s apparel export market, the industrial and consumer adhesives segment, and the unicellular closed-cell foams industry. The company has pioneered the import substitution of several highly technical products. In the foam sector, SRW holds ~90% of the market share, making it the largest supplier to Pakistan’s football manufacturing companies. On the adhesives side, the company commands a collective market share of ~25%. This leadership and diversification across multiple sectors underscore SRW’s strategic capabilities and robust market presence.
Revenues
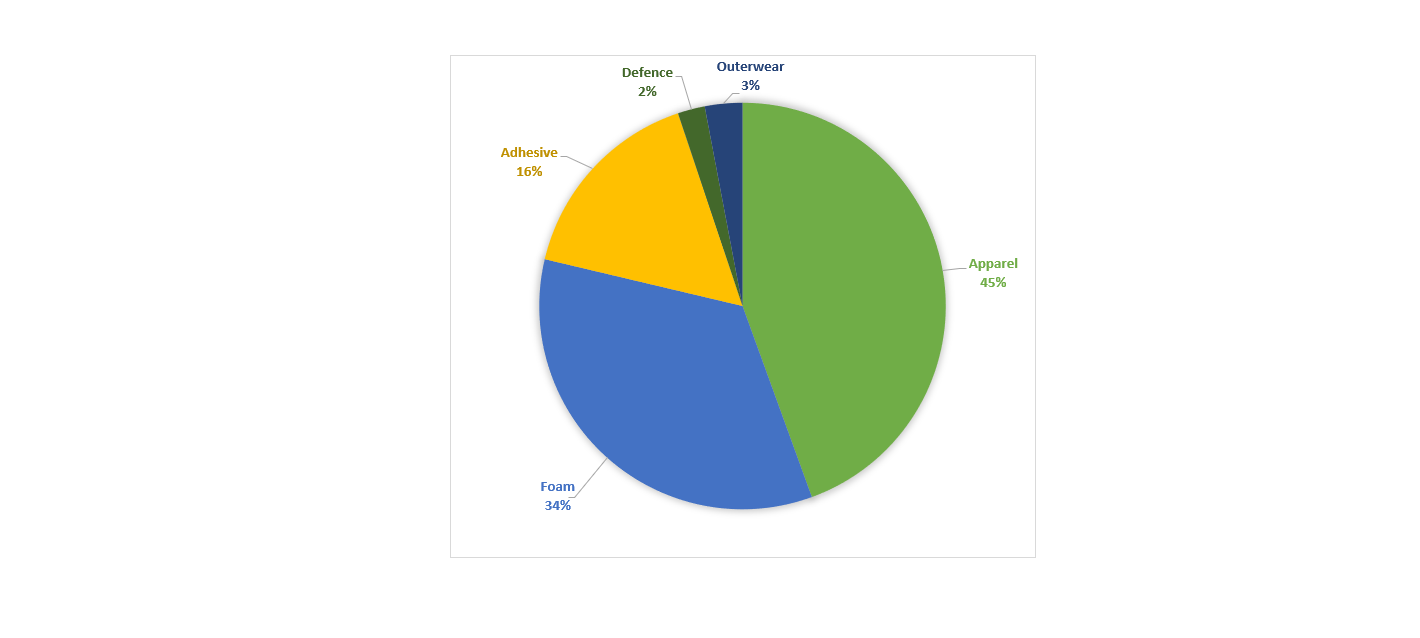
In FY24, the Company’s topline surged to ~PKR 10bln, up from ~PKR 8bln in FY23, reflecting a YoY growth of ~14.1%, primarily driven by a volumetric increase majorly in the apparel and outerwear segments. The revenue composition for FY24 was predominantly from Apparel products (~44.46%), followed by Foam (~34.24%), Adhesives (~16.15%), Outerwear products (~2.98%), and Defense/Military projects (~2.16%).
Chart 2: Segment wise Revenue Contribution

Margins
The Company’s gross and operating margins improved to ~20.3% and ~8.8%, respectively, due to an improved cost structure from the previous year. However, the net profit margin declined to 3.6%, primarily due to a substantial increase in tax expenses, which surged from ~PKR 77mln in FY23 to ~PKR 360mln in FY24. This significant rise in tax liability has offset the gains from sales and cost efficiencies.
Sustainability
Market conditions are projected to improve further, driven by advancements in forward-linked industries and a recovery in macroeconomic conditions. The Company has conducted comprehensive analysis and developed strategies to enhance revenue streams and profitability across all business units, while also exploring new market opportunities. Concurrently, the Company is actively transitioning to the 3rd Generation, ensuring their involvement in key decision-making processes. Additionally, the preparation of prudent financial projections would further strengthen the business’s sustainable growth practices.
Financial Risk
Working capital
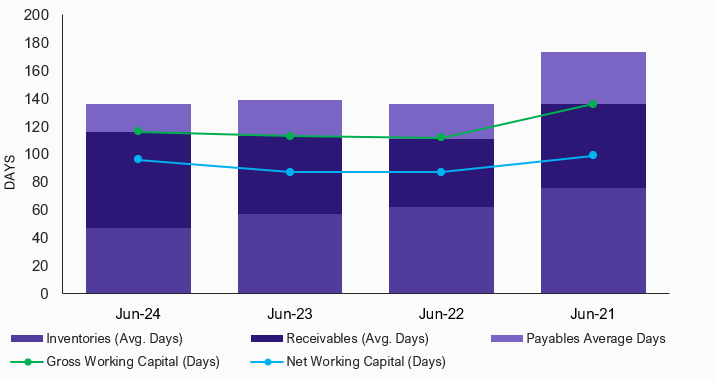
The Company’s capital requirements mainly stemmed from financing inventories and trade receivables, for which it relies on internal cash flow generation and short-term borrowings (STBs). In FY24, SRW’s gross working capital days remained relatively unchanged at ~116 days, compared to ~113 days in FY23. However, net working capital days increased from ~87 days in FY23 to ~96 days in FY24. This increase reflects a modest extension in the cash conversion cycle, attributed to longer receivable days and shorter payable days.
Chart 3: Working Capital Management

Coverages
In FY24, SRW’s free cash flow from operations (FCFO) modestly increased to ~PKR 847mln, compared to ~PKR 830mln in FY23, primarily driven by an improvement in PBIT. The company’s interest coverage ratio improved to 6.1x in FY24 from 5.3x in the prior year, reflecting enhanced earnings. However, the core debt coverage ratio declined to 3.5x from 4.0x, indicating a reduction in the company’s ability to cover its core debt obligations despite the overall financial improvements.
Capitalization
The Company’s debt portfolio predominantly consists of short-term borrowings, which account for ~86.9% of the total borrowings. In FY24, SRW maintained a moderately leveraged capital structure, with a leverage ratio of ~28.4%, up from ~26.3% in FY23. This increase is attributed to a rise in both long-term and short-term borrowings. The long-term borrowings were utilized to finance vehicles and a press machine, while the short-term borrowings were lent for day-to-day operations.
|


